|
|
Why do MLMs and their self employed dealers so often claim to
have an "outstanding
growth potential", when the figures tell a completely different story? Could it
be that the statistics were manipulated, or better said "fudged"?
That is indeed the case. Even Insiders accuse the WFDSA of latterly including more and more sales of non-member companies in order to make the numbers look better!
Quotation from the German magazine "Network Press", issue 40, page
62:
----------------------------------------------------------------------------------------------------------------------------------------------
"For
the first time in the long history of direct selling, the World Federation of
Direct Selling Association (WFDSA) had to announce a negative sales trend for
their worldwide organized member companies. It also leaves a bitter taste that
they try to manipulate their sales figures!"
"If WFDSA hadn't
added the sales of 'non member companies', a massive drop of sales would have
been seen."
"Without this manipulation, the member
companies would have had to declare a sales drop of more than 10 billions dollar
worldwide."
----------------------------------------------------------------------------------------------------------------------------------------------
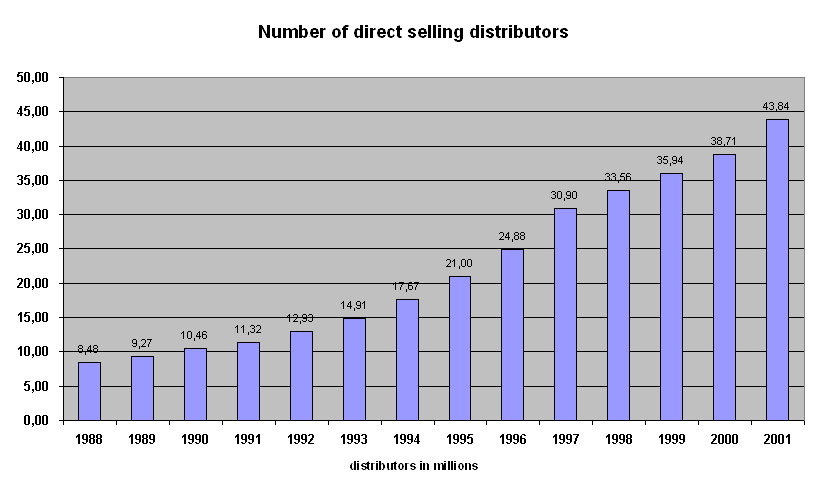
The WFDSA has also published the worldwide number of
direct selling distributors [2] for the years 1988 to 2001.
|
|
The chart shows a significant improvement. The number of
network-marketers increased. It increased for more than 15 percent. That is
impressive!... An increase of more than 5 million networkers. Just in one YEAR! In
2001!
That is really a positive signal, isn't it?
A positive
signal? For whom? For the MLM companies of course, because every MLM-Newbie
generates an entry business volume income for 'his' MLM company !
But is this
although a positive signal for each individual MLM distributor?
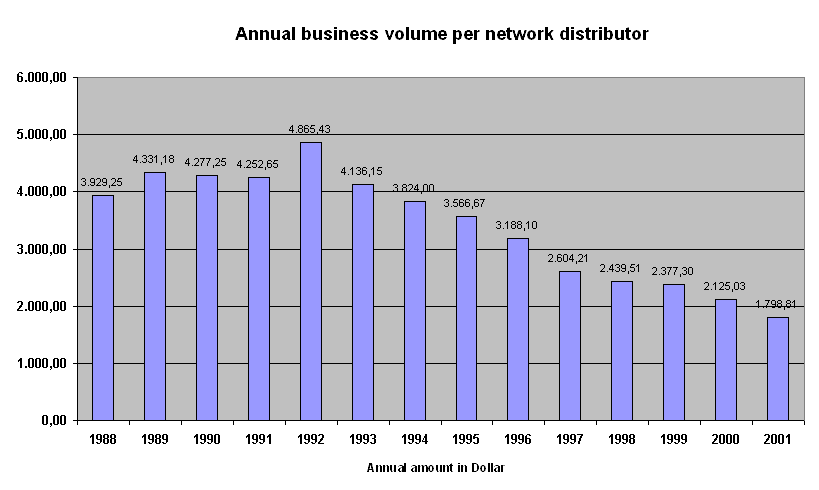
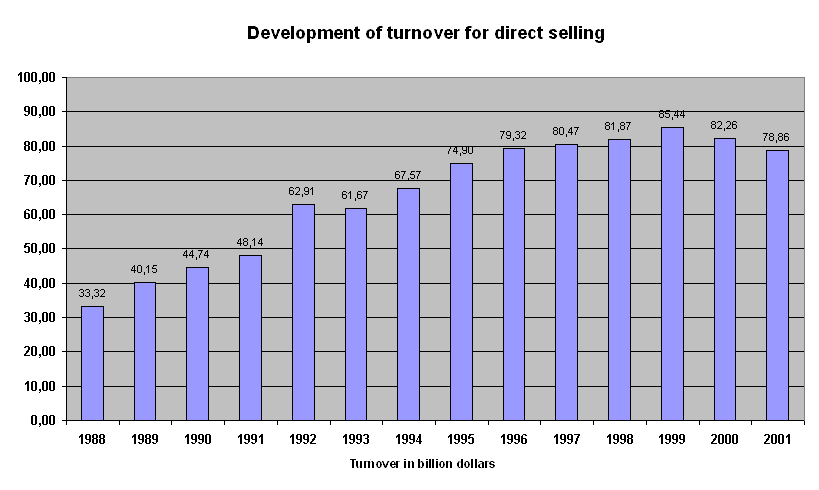
Let's now have a look at the development of an average MLM distributor's
business volume during the last few years. We divide the yearly turnover by
the number of networkers for the same year.
|
|
The result isn't really surprising, that
when sales (chart 1) drop
and the number of distributors goes up (chart 2) the individual distributors
will earn fewer and fewer...
Quotation from the German magazine "Network Press", issue 40, page
62:
----------------------------------------------------------------------------------------------------------------------------------------------
"Parallel
to the breakdown in sales, the amount of alleged world-wide active distributors
continuously rose, which means nothing else than that the sales per head dramatically
sank. This could also be an indication for the increasing presence of network
firms, because the traditional direct sale normally works with a lower
number of partners and thereby generating higher sales per head."
----------------------------------------------------------------------------------------------------------------------------------------------
According to the "Network Press", the sales per head within traditional direct sales
is higher than in MLM because of the fewer number of dealers required per company
to achieve the turnover. This
means that the per head sale for the many MLM companies must be even worse than
what is shown above. Despite this, MLM is often presented as the superior form of
marketing in comparision with direct selling.
Please note the fact that the average per head sales of the MLMers have
constantly fallen since 1992 - even when your so-called "sponsors" will
present them differently from the plain truth represented above. If he ever bothers to tell
you anything about it and if he really knows...
Ask
him. Find out if he knows what the sales trends are and what he knows about the
market place. The truth is, most distributors don't know anything about these
facts. Does your "sponsor" really know? How much has he voluntarily
told you?
And
what? And how? Maybe he doesn't know or he just tells you some lies. How can
you trust someone who might not know the vital basics of this business and might even
be intentionally misinforming you, his contractual partner... His answer could
be a slick and simple lie.
Examples can be found at the MLM-cemetery...
Anyway, the
WFDSA doesn't publish the average annual sales per networker. Wonder
why...?
However it's not sufficient to exclusively look at the annual sales per
networker because the sale is just the sum of the money taken in. By
selling goods one receives the selling price for the merchandise. However, one
must account for the purchase price for the goods sold - and doing this, the
biggest part, 50 to 95 per cent of the money taken in is gone.
In our example we assume a sales commission is a cushy 30 per cent:
This 30 per cent and ONLY these 30 per cent turns out to be the unadjusted
earnings of your sales activity.
|
|
These pitiful percentages can be seen with the help of a
magnifying glass in the expanded chart below.
|
|
Does your company pay higher commissions? If so, you are in a much better
position than many others. Their commission is only about 10 or 20 per cent. Their
results are EVEN WORSE.
We can't really say that this result is fine,
can't we? Specially because the average pro head income for a whole year of hard work amounts approximately
540 dollar! Or do you see that differently?
Normal operating costs for a MLM business outside of entertainment costs include office space, telephone, seminars, company functions, advertising, computer costs, books, catalogs, transportation expenses, insurance. The cost of the MLM magazine "Network Press" is $40/year. All of these are costs.
The type and size of these expenses are dependent on the type of products marketed and the individual companies. Estimating a $100/ month in business expenses, on the basis of 1988, the expenses are a know and small yearly amount. Because inflation this amount was incremented 3 per cent linear per year.
We set the monthly operating expenditures at $100. In practice however $2,700/month for operational expenses per month are not unrealistic - and found valid by the Finance Court Nürnberg Germany.
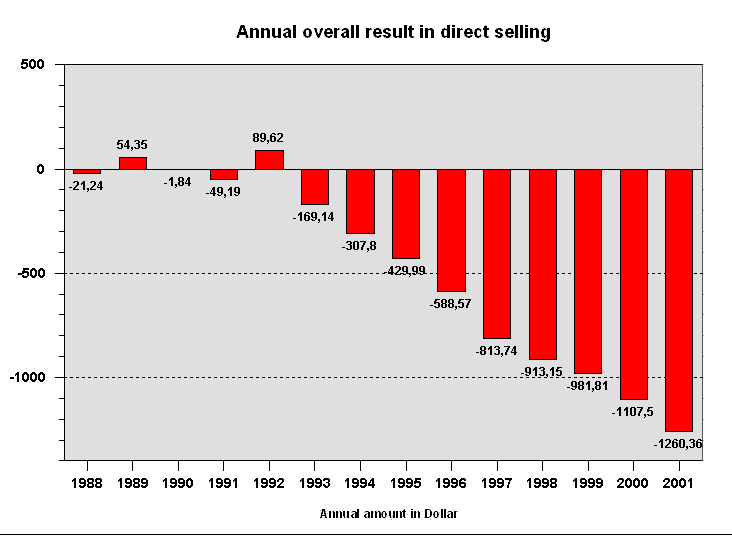
The numbers so far were pitiful, but at least positive, now they are dark red...
|
|
As we see, the (average) networker can't live from his (average) sales figures
in the red. And he couldn't even live from his (average) sales figures with
50 per cent commissions.
But, he also receives commissions from the sales of his downline,
i.e. from all these independent dealers he recruited before. So how many
downliners must he have at all then to reach the break even?
Before we
begin with calculating, we will take a closer look at the negative average
annual overall result:
|
|
The average commission for distributors of your team - and thus of your recruits
- reported by the magazine "Network Press" was 6 per cent:
Quotation from the German magazine "Network Press", issue 41, page
30:
----------------------------------------------------------------------------------------------------------------------------------------------
"Additionally
you should assume that within your organization the average sales will not be
higher than about 100 Euro per head. With an average commission of six per cent
you will then earn six Euro per month per
distributor."
----------------------------------------------------------------------------------------------------------------------------------------------
This means today you need at least 20 coworkers within your downline! (1,513 : 79.20)
According to the "Network Press" magazine the average distributor recruits
less than 3 new distributors.
Quotation from the German magazine "Network Press", issue 41, page
30:
----------------------------------------------------------------------------------------------------------------------------------------------
"...
never calculate that one of your distributors will recruit more than three new
persons - calculate with
fewer."
----------------------------------------------------------------------------------------------------------------------------------------------
That is pretty clear wording!
That means that you must recruit at least 7
new people by yourself. If some of them quit you will have to of course replace.
It will be a problem if your MLM only allows a tripple-matrix, because you can't
recruit more than 3 wide.
Also consider the fact that month for month
thousands of networkers quit and leave the business and have to be replaced!
Quotation from the German magazine "Network Press", issue 41, page
3:
----------------------------------------------------------------------------------------------------------------------------------------------
"Thousands
quit each month because they can't take the pressure from the
public..."
----------------------------------------------------------------------------------------------------------------------------------------------
Ergo: You need a bonus plan, which permits sufficient levels of
recruited distributors for every sponsor and you have to enlist 7 legs, which
actively sell and recruit.
In order to reach the break even point your
downline must be developed to at least 20 coworkers! Can you do
this?
But, you didn't sign up for all this hard work so that you could only breakeven,
did you? After a long month of hard work you shouldn't have earned enough money
to buy a loaf of bread?
A million dollar income?
Let's stay
realistic. But, you should earn at least as much as the cashier in the corner
supermarket, right?
The average German salesperson grosses, with their union agreement,
1,673.50 Euro per month [3]. This corresponds to yearly gross earnings of about
$22,100 (1,673.50 x 12 + 10 %). However, we have to add an additional 82 per
cent [ 4 ], which the employer has to spend for employee such as social
security, unemployment insurance, health care, etc...
The Networker
however is an independent business person and must pay the employers portion of
social security as well as his own health benefits. To develop the same
potential benefits and income the networker must instead earn $40,204 per/year.
In order to obtain the income of at least a store salesperson, you
would have to enlarge your downline to at least 508 people!
And you need 20 just to
breakeven. In addition 528 recruits!
Can you really achieve
this?
Actually you should earn more than a cashier in the supermarket. Because aside
selling your MLM products your main job is predominantly being a personal
manager for 528 downline business owners. That's why you should earn at least
the average German income.
The average German gross income is presently
2,376.50 Euro per month. When one includes the overhead and benefit costs that is
$57,093.04/year
In order to obtain the average German income, you have
to enlarge your downline to at least 721 downline business owners! You need 20
to break even, and now you need 741 recruits just to make an average wage. Do
you really think you can manage this 741 downline business owners
permanent?
Take a closer look at your compensation plan. How deep to they pay downline
commissions?
Finally let's have a look to this issue from another point of view. How about
those meetings where they award one of those over sized, poster board checks for
their "leaders"? On those checks you can see amounts such as "100,000 Euro". It
is implied that EVERYONE can do that, if they really want to...
But life
isn't so easy... let's compare the 100,000 Euro with the number of downliners
for the "leaders".
Strangely enough this number is often revealed. That is to show, how
successfully these "the leaders" really are. Because they have SO MANY
distributors, and because they motivate all these people they are called
leaders.
100,000 Euro out of a downline with 10.000 distributors means
10 Euro per head. If there are 16.000 distributors it's only 6 Euro per head -
and that is exactly the actual number published by the "Network
Press".
Thus everything fits together. One only has to find the right
numbers and know what they mean...
Once again the Quotation from the German magazine "Network Press", issue 41, page
3:
----------------------------------------------------------------------------------------------------------------------------------------------
"Thousands
quit each month because they can't stand the public
pressure..."
----------------------------------------------------------------------------------------------------------------------------------------------
Could it not be possible that it is much more than the simple explanation above?
Could it be the naked reality of the situation and the hard waking up out of a
world of dreams after the financial crash, and the realization of a lot of
wasted money? The distributor may decide to GO NO FURTHER, to cut his losses and
save what there is to save rather than continuing on a path of self destruction.
Let's look at the numbers one more time and take
a look at the operating costs. In order to break even, a networer has to recruit
20 members into his downline. If we use the 2003 figures of an average
networker, every one of them has operating costs of $1,909 per year. Just costs,
there are no products as compensation. It is a pure loss...
This means 21 x $1,909 = $40,089 for the complete downline. More
than FOURTYTHOUSAND dollar in
operational costs just to enable the top of this pyramid to reach the break
even, to have ZERO, to have nothing...
And now "the leader", the one with
this 100,000 Euro check, the general... pardon, the diamond, with the tremendous
downline of 16,000 recruits. He causes costs of 16,000 x 1,909 dollar per year.
$30,544,000 dollar! Pure costs! Costs without a single product as counter-value.
More than $30 million! What a gigantic waste of money...!
Wouldn't it be
better if each of these 16,000 downliners would pay a tribute of $79,20 dollar to
his king? Instead of a $1,513 loss, there would only be a 79,20 dollar loss. And
no work at all, no risk, no hurrying around, no sleepless nights, no divorces
and no troubles with friends and relatives...
...and one can still look at
yourself in the mirror....
In
summary here again the used numbers:
| Year | Sales in billions [1] |
Networkers in millions [2] |
Annual business
volume per networker |
pro rata commission |
Operating costs |
Annual unadjusted
earnings |
| 1988 | 33,32 | 8,48 | 3.929,25 | 1178,76 | 1.200,00 | -21,24 |
| 1989 | 40,15 | 9,27 | 4.331,18 | 1299,36 | 1.245,00 | 54,36 |
| 1990 | 44,74 | 10,46 | 4.277,25 |
1283,16 |
1.285,00 | -1,84 |
| 1991 | 48,14 | 11,32 | 4.252,65 |
1275,81 |
1.325,00 | -49,19 |
| 1992 | 62,91 | 12,93 | 4.865,43 |
1459,62 |
1.370,00 | 89,62 |
| 1993 | 61,67 | 14,91 | 4.136,15 |
1240,86 |
1.410,00 |
-169,14 |
| 1994 | 67,57 | 17,67 | 3.824,00 |
1147,20 |
1.455,00 |
-307,80 |
| 1995 | 74,90 | 21,00 | 3.566,67 |
1070,01 |
1.500,00 |
-429,99 |
| 1996 | 79,32 | 24,88 | 3.188,10 |
956,43 |
1.545,00 |
-588,57 |
| 1997 | 80,47 | 30,90 | 2.604,21 |
781,26 |
1.595,00 |
-813,74 |
| 1998 | 81,87 | 33,56 | 2.439,51 |
731,85 |
1.645,00 |
-913,15 |
| 1999 | 85,44 | 35,94 | 2.377,30 |
713,19 |
1.695,00 |
-981,81 |
| 2000 | 82,26 | 38,71 | 2.125,03 |
637,50 |
1.745,00 |
-1.107,50 |
| 2001 | 78,86 | 43,84 | 1.798,81 |
539,64 |
1.800,00 |
-1.260,36 |
| 2002 | 85,76 | 47,18 | 1.817,72 |
545,32 |
1.854,00 |
-1.308,68 |
|
|
|
|
|
|
|
|
|
2003 |
? |
? |
1.320 [6] |
396,00 |
1.909 [7] |
-1.513,00 |
The row for 2002 was added in 04/2005 with figures
published
by the DSA.
Addendum December 2004:
Here are some specific
figures, published by mlm companies. Please compare their annual business volumes
per networker with our projected results...
| Year | Sales in billions | Networkers | Annual business
volume per networker |
|
2002/03 |
0,111 € |
85.000 |
1.305,88 Euro |
| Year | Sales in billions | Networkers | Annual business
volume per networker |
|
2003 |
0,193 € |
80.800 |
2.388,61 Euro |
| Year | Sales in billions | Networkers | Annual business
volume per networker |
|
2003 |
0,250 € |
> 190.000 |
1.315,78 Euro |
| Year | Sales in billions | Networkers | Annual business
volume per networker |
|
|
0,004 € |
> 9.000 |
444,44 Euro |
| Year | Sales in billions | Networkers | Annual business
volume per networker |
|
2004 |
2,1 € |
7.500.000 |
215,38 Euro |
| Year | Sales in billions | Networkers | Annual business
volume per networker |
|
2003 |
0,009 € |
12.000 |
766,67 Euro |
| Year | Sales in millions | Networkers | Annual business
volume per networker |
|
2004 |
331,1 $ |
637.000 |
519,78 Dollar |
| Year | Sales in millions | Networkers | Annual business
volume per networker |
|
2004 |
652 € |
> 1.500.000 |
434,66 Euro |
| Year | Sales in millions | Networkers | Annual business
volume per networker |
|
2004 |
1.800 $ |
> 1.300.000 |
1.107 Euro |
Please read Jon M. Taylor's study
Who Profits from Multi-Level
Marketing*?
Preparers of Utah Tax Returns Have the Answer.
at
http://www.mlm-thetruth.com/tax_study.htm
References:
Document endorsed: 14.06.2005